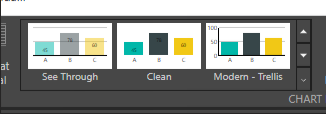
From the Component Ribbon, users can preview the properties of each particular visualization. Hovering over the samples on the ribbon will display a tooltip with the properties of the chart. To change the visualization display, click on the preset.
This feature is available in the following visual types:
- Grids
- Maps
- Column Chart
- Bar Chart
- Line Chart
- Area Chart